Saturday, March 08, 2014

Disconnecting Consciousness from the External Environment with Electrical Stimulation


From the Neuroskeptic blog at Discover Magazine, this is a cool article describing a new discovery a small region in the brain (in the white matter beneath the left posterior cingulate cortex [PCC]) that when stimulated creates a state of dissociation that is experienced as a dream for the person whose brain has been stimulated. Very interesting stuff.

Disconnecting Consciousness from the External Environment

By Neuroskeptic | February 23, 2014

An very interesting report from a group of French neurosurgeons sheds light on the neural basis of consciousness and dreams.

Guillaume Herbet and colleagues describe the case of a 45 year old man in whom electrical stimulation of a particular spot in the brain “induced a dramatic alteration of conscious experience in a highly reproducible manner.

The man had brain cancer (a diffuse low-grade glioma of the posterior left hemisphere). During the surgery to remove the tumour, Herbet et al stimulated various points on his brain to map out the areas that were functionally most important. This is a standard procedure to allow surgeons to know which bits they ought to leave intact, where possible.

Most of the stimulations didn’t do much, but there was a particular point, in the white matter beneath the left posterior cingulate cortex (PCC), where the electrical pulse caused the patient to become unresponsive – to ‘zone out’, essentially – for a few seconds. This point is marked as “S1″ (small blue spot) on these images. The red zone on the left is the area that was eventually removed.


Upon regaining awareness after the stimulation, the patient reported that he had been ‘in a dream’. Three stimulations of the same area produced three such reveries:
Quite surprisingly, he described himself retrospectively as in a dream, outside the operating room, and was able to fleetingly report his subjective experiences (stimulation 1: “I was as in a dream, there was a sun”; stimulation 2: I was as in a dream, I was on the beach”; stimulation 3: “I was as in a dream, I was surrounded by a white landscape”. No additional sites in the surrounding anatomical space were found to elicit this manifestation.
Suns and beaches doesn’t sound like the stuff of nightmares. But the patient said that these dreams were, in fact, unspeakably horrible:
However, the simple mention of the event was associated with a strong emotional discharge, including crying and tremors, and finally the patient always said: “I don’t remember, I don’t want to remember”
All very gothic. But what does it mean? Herbet et al say that
Disrupting the subcortical connectivity of the left posterior cingulate cortex (PCC) reliably induced a breakdown in conscious experience.
Which fits with the theory that the PCC – a ringleader of the brain’s default mode network – is central to waking consciousness. But what’s odd is that a large chunk of the left PCC was not just disrupted but permanently cut out, and it didn’t destroy the patient’s consciousness – although
He reported experiencing no rumination and no negative thought for almost a month after the surgery. He described himself in a kind of contemplative state, with a subjective feeling of absolute happiness and timelessness.
Sounds almost like spiritual enlightenment, but it only lasted a month; after that, it seems, he returned more or less to normal consciousness – even thought that chunk of PCC was still gone. So I’d say this case report, while fascinating, raises more questions than it answers.

Full Citation:
Herbet G, Lafargue G, de Champfleur NM, Moritz-Gasser S, le Bars E, Bonnetblanc F, & Duffau H (2014). Disrupting posterior cingulate connectivity disconnects consciousness from the external environment. Neuropsychologia, 56C, 239-244 PMID: 24508051
Full abstract for the original article - the article itself is behind a paywall.

Disrupting posterior cingulate connectivity disconnects consciousness from the external environment.

Neuropsychologia. 2014 Feb 4;56C:239-244. doi: 10.1016/j.neuropsychologia.2014.01.020. [Epub ahead of print]

Abstract

Neurophysiological and neuroimaging studies including both patients with disorders of consciousness and healthy subjects with modified states of consciousness suggest a crucial role of the medial posteroparietal cortex in conscious information processing. However no direct neuropsychological evidence supports this hypothesis and studies including patients with restricted lesions of this brain region are almost non-existent. Using direct intraoperative electrostimulations, we showed in a rare patient that disrupting the subcortical connectivity of the left posterior cingulate cortex (PCC) reliably induced a breakdown in conscious experience. This acute phenomenon was mainly characterized by a transient behavioral unresponsiveness with loss of external connectedness. In all cases, when he regained consciousness, the patient described himself as in dream, outside the operating room. This finding suggests that functional integrity of the PPC connectivity is necessary for maintaining consciousness of external environment.

Friday, March 07, 2014

Time for Actions in Lucid Dreams: Effects of Task Modality, Length, and Complexity


From Frontiers in Psychology: Consciousness Research, this recent article looks at the nature of time in task performance in lucid dreams vs. waking space. They found that any motor task such as squats (previous study), walking, or gymnastics takes more time in lucid dreams than in the waking world.

Among the questions raised by this study:
Longer durations in lucid dreams might be related to the lack of muscular feedback or slower neural processing during REM sleep. Future studies should explore factors that might be associated with prolonged durations.
I would wager that a significant portion of the difference in time is a result of the lack of muscular feedback in performing the motor task.

Full Citation:
Erlacher D, Schädlich M, Stumbrys T andSchredl M. (2014, Jan 16). Time for actions in lucid dreams: Effects of task modality, length, and complexity. Frontiers in Psychology: Consciousness Research; 4:1013. doi: 10.3389/fpsyg.2013.0101

Time for actions in lucid dreams: effects of task modality, length, and complexity

Daniel Erlacher [1], Melanie Schädlich [2], Tadas Stumbrys [2], and Michael Schredl [3]
1. Institute of Sport Science, University of Bern, Bern, Switzerland
2. Institute of Sports and Sports Sciences, Heidelberg University, Heidelberg, Germany
3. Medical Faculty Mannheim, Central Institute of Mental Health, Heidelberg University, Mannheim, Germany

The relationship between time in dreams and real time has intrigued scientists for centuries. The question if actions in dreams take the same time as in wakefulness can be tested by using lucid dreams where the dreamer is able to mark time intervals with prearranged eye movements that can be objectively identified in EOG recordings. Previous research showed an equivalence of time for counting in lucid dreams and in wakefulness (LaBerge, 1985; Erlacher and Schredl, 2004), but Erlacher and Schredl (2004) found that performing squats required about 40% more time in lucid dreams than in the waking state. To find out if the task modality, the task length, or the task complexity results in prolonged times in lucid dreams, an experiment with three different conditions was conducted. In the first condition, five proficient lucid dreamers spent one to three non-consecutive nights in the sleep laboratory. Participants counted to 10, 20, and 30 in wakefulness and in their lucid dreams. Lucidity and task intervals were time stamped with left-right-left-right eye movements. The same procedure was used for the second condition where eight lucid dreamers had to walk 10, 20, or 30 steps. In the third condition, eight lucid dreamers performed a gymnastics routine, which in the waking state lasted the same time as walking 10 steps. Again, we found that performing a motor task in a lucid dream requires more time than in wakefulness. Longer durations in the dream state were present for all three tasks, but significant differences were found only for the tasks with motor activity (walking and gymnastics). However, no difference was found for relative times (no disproportional time effects) and a more complex motor task did not result in more prolonged times. Longer durations in lucid dreams might be related to the lack of muscular feedback or slower neural processing during REM sleep. Future studies should explore factors that might be associated with prolonged durations.


Introduction


The question of time in dreams is frequently debated in science, philosophy and recently also by Hollywood film makers. For instance, in the movie Inception (Nolan and Thomas, 2010), dream time runs much slower than real time, 5 min of real time equaling 1 h of dream time. The idea, which inspired Christopher Nolan, the director of Inception, that time is scaled down during dreams, can be traced back a century and a half to the work of the French scholar Alfred Maury (1861), who was convinced that dreams are created at the moment of waking up. He based this assumption on a subjectively long-lasting dream about the French Revolution, at the end of which the dreaming Maury was to be beheaded under the guillotine. When he was roughly awoken by a piece of his bed (la flèche de mon lit) which had fallen on his neck, Maury assumed that the whole dream had been created at that very moment, leading up to the guillotine scene.

Maury's dream explanation led to the so-called Goblot hypothesis. In 1896 the French logician Edmond Goblot (1896) proposed that remembered dreams occur during the process of awakening and that a difference exists, therefore, between the time experienced in a dream and the time which actually passes while the dream is taking place. Hall (1981) tried to find evidence to support the Goblot hypothesis by showing that stimuli of a sleeper's surrounding as well as internal stimuli, such as hunger, were represented in the dreams of his subject who had recorded his dreams for two years. While such correspondence was found to some extent, Hall admitted himself that this does not prove that these dreams are generated during awakening, as external and internal stimuli “… are or may be present while we are asleep or before we go to sleep” (Hall, 1981, p. 245). In this approach the assumptions concerning time in dreams were indirect implications of a hypothesis on the origin of dreams in general. The idea that dreams are instantaneous memory insertions experienced at the moment of awakening also plays a major role in philosophical debates, for example in Dennett's cassette-theory of dreaming (Dennett, 1976).

A few years after the discovery of rapid-eye movement (REM) sleep and its initial association with dreaming (Aserinsky and Kleitman, 1953), Dement and Kleitman (1957) explored more precisely the relationship between REM sleep and dream activity. In one of their experiments, they wanted to demonstrate the relation between the lengths of periods of rapid eye movements and the subjects' estimations of how long they had been dreaming. In their study, participants were awakened randomly, either 5 or 15 min after REM onset, and were then asked if they had dreamed 5 or 15 min. In 92 out of 111 awakenings (83%) the participants judged correctly. The authors also found a correlation between the elapsed amount of time and length of dream reports (r = 0.40 to r = 0.71). These results were replicated by other researchers (e.g., Glaubman and Lewin, 1977; Hobson and Stickgold, 1995) and nowadays it is a widely accepted hypothesis that subjectively experienced time in dreams corresponds with the actual time. Yet, a study conducted by Moiseeva (1975) found that in dreams with a complex and bizarre structure or in very emotional dreams, time can be perceived as flowing much faster, exceeding the absolute time span of a dream by 2–10, 25–50 or even 100 times.

While in regular dream studies, this correspondence can only be explored on a correlational basis and retrospectively, a completely different approach opens when conducting studies with lucid dreamers. A lucid dream is defined as a dream during which dreamers, while dreaming, are aware they are dreaming (LaBerge, 1985). Lucid dreams are considered to be mainly REM sleep phenomena (LaBerge, 1990). Lucid dreamers can consciously influence the dream content and are thus able to carry out prearranged tasks while dreaming (e.g., Fenwick et al., 1984; Erlacher and Schredl, 2008a, 2010). In order to mark events or actions in a lucid dream, lucid dreamers can produce a specific pattern of eye movements (e.g., left-right-left-right) that can be objectively identified on an electrooculogram (EOG) recording (cf. Erlacher et al., 2003). Lucid dreams are especially useful for studying time intervals in the dream state because the beginning and end of a certain action can be marked with eye signals while the sleep is recorded using standard polysomnography.

In general, lucid dream studies conducted in sleep laboratories demonstrated that a certain time is needed during the recorded REM period. However, only two studies explored time in lucid dreams explicitly. In a pilot study, LaBerge (1985) demonstrated that the time interval for counting from one to ten in a lucid dream is about the same compared to that of wakefulness. Erlacher and Schredl (2004) investigated the duration of a sequence of squats (deep knee bends) compared to what would have been necessary in wakefulness. Five participants performed the following task both in wakefulness and while dreaming lucidly: Counting five seconds, performing ten squats and counting five seconds again. By means of eye signals, the durations of each counting or squat sequence could be determined and compared to the duration of waking performances. While there was no significant difference between wakefulness and dream state for the counting intervals, participants required about 40% more time for performing squats in lucid dreams than in the waking state. This finding contradicts the results of prior studies which supported equivalence of dream time and physical time.

Different explanations can be used to explain why more time was required for performing squats in the dream state. Firstly, there might be a difference between the task modalities. For example, tasks that involve an activation of the body concept in the dream could require more time due to a more complex simulation of this body schema. Secondly, there might be a difference due to the task duration: In the study described above by Erlacher and Schredl (2004), the motor task (M = 17.84 s, SD = 6.8) lasted almost three times as long as the counting task (first counting: M = 6.26 s, SD = 1.7; second counting: M = 6.48 s, SD = 1.0), when measured in wakefulness. Therefore it might be possible that longer tasks generally lead to increased durations in the dream state. Further, if there is indeed a need for more complex simulation to take more time in the dreaming state, then more complex actions in the dream should also lead to longer durations.

In the present study we conducted further experiments to explore the effects of task modality (involving motor activity vs. not involving motor activity), length (intervals of 10, 20, or 30 s/steps), and complexity (simple motor task vs. complex motor task) on task durations in lucid dreams. The durations of three different tasks were compared in wakefulness and in lucid dreams: counting, walking and a gymnastic routine.


Materials and Methods 


Participants

Participants were recruited either from previous studies or by advertisement via different media about lucid dreaming, including a German web page (http://klartraum.de), or from lucid dream induction studies in which specific techniques were applied in order to induce lucidity (e.g., MILD, LaBerge, 1980). Table 1 depicts the participants who successfully finished one of the three experimental protocols (the walking and gymnastic tasks included not only lucid dreamers but also sports students who participated in a lucid dream induction study. The average lucid dream frequency in these groups was thus somewhat lower). Informed consent was obtained from the participants and participation was paid.


TABLE 1
http://www.frontiersin.org/files/Articles/53483/fpsyg-04-01013-HTML/image_m/fpsyg-04-01013-t001.jpg

Table 1. Participants characteristics.

Experimental Conditions

The task descriptions for the three conditions:

Counting

For the counting task, participants had to count from 1 to 10, from 1 to 20, and from 1 to 30 at their own regular pace. During counting, participants were asked not to move (see Figure 1 as an example).


FIGURE 1
http://www.frontiersin.org/files/Articles/53483/fpsyg-04-01013-HTML/image_m/fpsyg-04-01013-g001.jpg

Figure 1. Experimental protocol for the lucid dream task (counting).

Walking

For the walking task, participants had to walk 10 steps, 20 steps, and 30 steps at their own regular pace.

Gymnastic routine

The gymnastic routine consisted of four consecutive elements starting in an upright position with feet together. Participants were instructed to count along while performing the elements (see Supplement 1):

Count 1, 2: Straight jump, landing with feet apart to the left and right, straight jump, putting feet together again

Count 3, 4: Straight jump, landing with feet apart to front and back, straight jump, putting feet together again

Count 5, 6, 7, 8: roll forward, standing up

Count 9, 10: Straight jump with half turn (180°)

For the counting and walking task, participants performed the task at their own regular pace. The gymnastic routine was developed to match the walking 10 steps condition regarding the task duration in wakefulness. The task was presented by the experimenter and the participants were asked to perform the task at the same speed and pace.

Sleep Recordings

In all studies, polysomnography was conducted to register the sleep stages. Sleep was recorded by means of the following standard procedures: electroencephalogram (EEG; C3 and C4 for counting and walking; F3, F4, C3, C4, O1, and O2 for gymnastic), EOG, submental electromyogram (EMG) and electrocardiogram (ECG). The data was recorded during the entire night (or during afternoon nap for one participant) by a standard recording device (XLTEK Trex Longtime EEG recorder or Schwarzer ComLab 32). Sleep stages for the counting and walking conditions were scored according to Rechtschaffen and Kales (1968) while those for the gymnastic condition were scored in accordance to the Manual of the American Academy of Sleep Medicine (2008).

Procedure

The participants spent one to three non-consecutive nights in a sleep laboratory. One participant was recorded twice during an afternoon nap at about 3 pm.

Before sleep, participants received task instructions (see above) in written and oral forms. Afterwards, participants were instructed about left-right-left-right (LRLR) eye signals to mark task events in a lucid dream. The first signal was always to mark the onset of lucidity. In the counting and walking task participants had to mark the beginning of each task sequence as well as the end of the task (five signals for each successful dream). As an example, the exact protocol for the counting task is depicted in Figure 1. In the gymnastic routine, apart from the first signal for the onset of lucidity, only the beginning and the end of the task had to be marked (three signals for each successful dream).

After the participants were familiar with the task and eye signaling, they carried out the task five times in wakefulness (including eye signals). In order to determine the duration of the task in wakefulness, in the counting and walking task the participants measured the times by themselves using a stopwatch—starting after the first eye signal and stopping with the onset of the second one. Because in the gymnastic routine it was not practical for the participants to handle the stopwatch, the experimenter started and stopped the times, according to a verbal signal from the participant, which was given immediately after and before the respective eye signal. For lucid dreams the time intervals were defined as the interval from the end of one LRLR eye signal to the beginning of the next LRLR and so on (see Figure 2).


FIGURE 2
http://www.frontiersin.org/files/Articles/53483/fpsyg-04-01013-HTML/image_m/fpsyg-04-01013-g002.jpg

Figure 2. A sample of one correctly signaled lucid dream for the counting task. Five LRLR eye signals are depicted. The interval between two LRLR eye signals corresponds to the counting interval (gray area).

During the night the experimenter monitored the recordings and woke participants up when recordings showed any of the following criteria: (1) A false awakening, i.e., the recording showing LRLRLRLR eye movements (signal for being awake, see below) but the EEG and EMG channel still showing characteristics for REM sleep. (2) Loss of lucidity, i.e., the recording showing five correct LRLR eye movements in the EOG channel, but no further eye signals occurring 30 s after the previous signal. These criteria were set in order to keep participants from sleeping on and forgetting specific parts of their lucid dreams (Erlacher and Schredl, 2008a). After accomplishing the task successfully in one lucid dream, the participants were to wake themselves up by the technique of focusing on a fixed spot in the lucid dream as described by Tholey (1983). In two cases the experimenter had to wake up participants after false awakening; in all other cases the participants woke up by themselves after finishing the lucid dream task (no cases of loss of lucidity).

The awakening had to be signaled by left-right-left-right-left-right-left-right eye movements (LRLRLRLR). After each lucid dream, participants wrote down a complete and precise dream report. Also they were asked whether they had been lucid and the task had been performed correctly by using a protocol which checked for each element of the task (e.g., eye signals). Any deviations from the protocol were highlighted (e.g., “only a single LR eye movement instead of a pair”) and evaluated to determine whether the data should be excluded. The complete set of dream reports used for data analysis can be found in Supplement 2.

Excluded Data

Out of n = 37 recorded lucid dreams n = 16 cases (counting: n = 2; walking: n = 4; gymnastic routine: n = 10) could not be used for the analysis. The criteria for inclusion of a data set were strict, in order to ensure that only lucid dreams conforming exactly to the protocol were used. A data set was excluded for one or more of the following reasons:
● One or more LR eye signals were not detectable in the recording (counting: n = 2; walking: n = 3; gymnastic routine: n = 5)
● An element of the task was skipped or the participant was unsure about having performed one or more of the elements (gymnastic routine: n = 1)
● The participant stated in the dream report that he or she had imagined the performance rather than carried it out “physically” (gymnastic routine: n = 2)
● The dream report showed that there was a delay between eye signal and task performance, e.g., one participant stated in the protocol that she had hesitated for a moment between the second eye signal and the start of the motor routine to recall the exact sequence of the task (gymnastic routine: n = 1)
● The dream content directly influenced the time of the task performance (walking: n = 1; gymnastic routine: n = 1).
To illustrate the last category, the two dream reports will be presented in detail (Original dream reports were in German, translations were done by the authors):

Dream example 1 Slow motion in the dream (gymnastic routine)

[longer dream sequence before] Then I did the LRLR and then I was here, the water was gone, but the floor was dark. I also felt that after this eye signal suddenly it was blurry again. I waited until it got better and then I walked around, wanting to find a brighter spot where I could see better and have more space. I went to a garden where it was bright and I thought, “Okay, I am doing the experiment now.” I gave a LRLR and I jumped and I felt immediately that jumping was very different compared to wakefulness. Just a different perception of the body, also slower. I continued and I did the forward roll—which lasted almost eternally. When I finished the task I gave a LRLR again”

The task duration was indeed 163% longer than in wakefulness (14.8 vs. 5.6 s).

Dream example 2: Running in the dream (walking)

[longer dream sequence before] We talked for about 5 min about the dream I had and that I often have nightmares. Suddenly, I was back at the party and saw the lights again but this time I realized that I was dreaming and did the LRLR. Afterwards I did the protocol but I was running instead of walking the steps. First 10, then 20 and then 30 steps. Finally I woke up”

The task duration was indeed significantly shorter than in wakefulness and therefore the data set was excluded for the statistical comparison of absolute times between wakefulness vs. lucid dream state (3.2). However, the data set is of special interest for the relative time and therefore it was included in the comparison of the relative timing analysis (3.1).

Statistical Analysis

Due to the small sample sizes, individual data are presented and analysis focuses mainly on a descriptive level. Furthermore, for the comparison of times between wakefulness and lucid dreaming, no predictions were made and, therefore, two-tailed statistical t-tests (dependent samples) as well as Wilcoxon tests were applied. For the comparison of task complexity, time differences between wakefulness and lucid dreaming for walking 10 steps and the gymnastic routine were calculated and two-tailed statistical t-test (independent samples) as well as Mann-Whitney-test applied. For all statistical tests a significance level of alpha = 0.05 was used. SPSS Statistics 20 software was used for the statistical analysis. For differences in times between wakefulness and lucid dreaming effect sizes d (Cohen, 1988) were calculated by the open-source software G∗Power V 3.1.3 (Faul et al., 2007). Cohen (1988) differentiated between small (d = 0.2), medium (d = 0.5), and large (d = 0.8) effect sizes.


Results 


Absolute and Relative Times for Counting, Walking and Gymnastics

Figure 2 shows a sample of a correctly signaled lucid dream for the counting task with five LRLR eye signals. The participant reported the following dream after awakening:

Dream example 3. Correctly signaled lucid dream (counting)

“I was awake and tried WILD [WILD stands for Wake-Initated Lucid Dream which is a technique to induce lucid dreams] which did not induce lucidity immediately. There was a long dream sequence where I had barbecue with some friend. Then I was in a basement with some cupboards and I played with some kids and adults. I knew that I was dreaming and I started to do the protocol: 1. LRLR for “I'm lucid,” 2. LRLR for counting from 1 to 10, 3. LRLR for counting from 1 to 20, 4. LRLR for counting from 1 to 30. After finishing the protocol I waited for a couple of seconds and the dream started to dissolve.”

The interval between two LRLR eye signals corresponds to the counting interval (gray area). Figure 3 depicts the absolute times for the counting task during wakefulness and lucid dreaming. In three cases (P2m32, P3m23, P4f24) the absolute time was longer during lucid dreaming than in wakefulness. Figure 4 depicts the relative times for the counting task during wakefulness and lucid dreaming, e.g., the total time for the whole task equals 100%. Because the ratio for the three parts are 1/6 the expected relative time for counting from 1 to 10 is 16.7%, for counting from 1 to 20 is 33.3% and for counting from 1 to 30 is 50% (marked with the red lines in Figure 4). The differences between the expected percentage and the relative time structure of the counting task in wakefulness are M = 1.1% (SD = 0.6%), M = 0.5% (SD = 0.7%) and M = −1.5% (SD = 0.6%) and in lucid dreaming are M = 0.6% (SD = 0.3%), M = 1.6% (SD = 1.5%) and M = −2.2% (SD = 1.6%) (for counting to 10, 20, and 30, respectively).


FIGURE 3
http://www.frontiersin.org/files/Articles/53483/fpsyg-04-01013-HTML/image_m/fpsyg-04-01013-g003.jpg

Figure 3. Absolute durations for the counting task during wakefulness and lucid dreaming (Labels: e.g., P1m28 = Participant 1, male, 28 years. ∗Participants of the counting task also completed the walking task). 
FIGURE 4
http://www.frontiersin.org/files/Articles/53483/fpsyg-04-01013-HTML/image_m/fpsyg-04-01013-g004.jpg

Figure 4. Relative durations for the counting task during wakefulness and lucid dreaming (Labels: e.g., P1m28 = Participant 1, male, 28 years. ∗Participants of the counting task also completed the walking task).

Figure 5 depicts the absolute times for the walking task during wakefulness and lucid dreaming. In five cases (P2m32, P3m23, P4f24, P5m34, P7f22) the absolute time was longer during lucid dreaming than in wakefulness. P8m24 exhibits significantly shorter time; however, the participant in this experiment experienced his first lucid dream and reported he was running instead of walking in the steps. Figure 6 depicts the relative times for the walking task during wakefulness and lucid dreaming, e.g., the total time for the whole task equals 100%. Again, the ratio for the three parts are 1/6 and the expected relative time for walking 10 steps is 16.7%, walking 20 steps is 33.3% and walking 30 steps is 50% (marked with the red lines in Figure 6). The differences between the expected percentage and the relative time structure of the walking task in wakefulness are M = 1.2% (SD = 0.8%), M = −0.2% (SD = 0.6%) and M = −1.0% (SD = 0.5%) and in lucid dreaming are M = 1.8% (SD = 2.7%), M = −1.5% (SD = 1.9%) and M = −0.3% (SD = 3.2%) (for walking 10, 20, and 30 steps, respectively).


FIGURE 5
http://www.frontiersin.org/files/Articles/53483/fpsyg-04-01013-HTML/image_m/fpsyg-04-01013-g005.jpg
Figure 5. Absolute durations for the counting task during wakefulness and lucid dreaming (Labels: e.g., P1m28 = Participant 1, male, 28 years. ∗Participants of the counting task also completed the walking task). 
FIGURE 6
http://www.frontiersin.org/files/Articles/53483/fpsyg-04-01013-HTML/image_m/fpsyg-04-01013-g006.jpg
Figure 6. Relative durations for the counting task during wakefulness and lucid dreaming (Labels: e.g., P1m28 = Participant 1, male, 28 years. ∗Participants of the counting task also completed the walking task).

Figure 7 depicts the absolute times for the gymnastic task during wakefulness and lucid dreaming. In six cases (P9f25, P11m25, P12f24, P13f20, P14f25, P16f24) the absolute time was longer during lucid dreaming than in wakefulness. In the other two cases (P10m24, P15f35) the duration of the gymnastic routine was slightly shorter in the lucid dream state than in wakefulness.


FIGURE 7
http://www.frontiersin.org/files/Articles/53483/fpsyg-04-01013-HTML/image_m/fpsyg-04-01013-g007.jpg
Figure 7. Absolute durations of the gymnastic routing during wakefulness and lucid dreaming (Labels: e.g., P1f25 = Participant 1, female, 25 years). 

Comparison of Absolute Times between Wakefulness vs. Lucid Dream State

Table 2 summarizes the absolute times required for the counting, walking and the gymnastic task during wakefulness and lucid dreaming. For the counting and walking tasks, the total time is calculated by sum of counting to 10, 20, and 30 or walking 10, 20, and 30 steps. P8m24 was excluded for this statistical analysis because he was running instead of walking the 10, 20, and 30 steps. Statistically significant differences were found for the two tasks with motor activity, walking (p = 0.03) and gymnastics (p = 0.03) but not for the counting task (p = 0.10) (for statistical details see Table 2). In the lucid dream condition, the durations for counting were 27.2%, for walking 52.5% and for the gymnastic routine 23.2% longer than in wakefulness. The effect sizes for all three conditions were quite high (between 0.94 and 1.06), but for the counting task the statistical power was low (0.54).


TABLE 2
http://www.frontiersin.org/files/Articles/53483/fpsyg-04-01013-HTML/image_m/fpsyg-04-01013-t002.jpg

Table 2. Comparisons of times in wakefulness and lucid dreaming. 

Comparison of Walking 10 Steps vs. Gymnastic Routine

Figure 8 depicts means and standard deviations for the walking 10 steps and the gymnastic routine during wakefulness and lucid dreaming. In wakefulness the gymnastic routine lasted M = 6.6 s (SD = 0.1) and therefore matched the time for walking 10 steps (M = 6.7 s, SD = 0.3). Comparing the two tasks with motor activity but different complexity, no statistically significant effects were found, t(13) = 1.6, p = 0.14, d = 0.78, power = 0.42; Mann-Whitney-U: Z = 1.04, p = 0.30. Moreover, the more complex gymnastic routine required less time (8.1 s) than walking 10 steps (10.6 s) during lucid dreaming. Again, for this statistical analysis P8m24 was excluded because he was running instead of walking the 10, 20, and 30 steps.


FIGURE 8
http://www.frontiersin.org/files/Articles/53483/fpsyg-04-01013-HTML/image_m/fpsyg-04-01013-g008.jpg

Figure 8. Means and standard deviations for walking 10 steps and the gymnastic routine during wakefulness and lucid dreaming.


Discussion


In this study, longer durations were observed for all types of tasks in lucid dreams as compared to those when awake. The greatest increase in time was for walking (52.5%) while the lowest increase was for gymnastics (23.2%). The increase for counting was 27%, but did not reach statistical significance. The differences in time, however, were observed only for the absolute durations of the task, but not for the relative durations.

Before discussing the results, some limitations of the present study should be acknowledged. One of the biggest limitations is the small sample sizes. Small sample size is always related to statistical drawbacks because it is hard to determine if the data meet all prerequisites for parametrical testing (e.g., normality). In order to account for such statistical problems we, firstly, concentrated on presenting sufficient descriptive statistics and, secondly, ran additional non-parametric tests (Wilcoxon test). The obvious advantage of t-tests is that effect size (Cohens d) and test power can be calculated and therefore those results are presented in Table 2. Because in this study effect sizes are large (d > 0.8) and test power ranges from 0.5 to 0.8 the probability for type II error is high (as in the case of counting).

Increasing sample size in lucid dream studies is not easy because the enrolment of proficient participants is always complicated. In a representative survey by Schredl and Erlacher (2011) it was shown that about 50% of the population experienced at least one lucid dream, however only 1.2% have lucid dreams on a very frequent basis (e.g., several times a week) which is necessary for sleep laboratory studies. Further, in addition to becoming lucid, participants also need to remember the task, accomplish it, and produce unambiguous eye signals. A recent survey of lucid dreamers (Stumbrys et al., in press) showed that lucid dreamers are able to remember their waking intentions in lucid dreams in only about half of the occasions and only less than half of those remembered intentions can be successfully accomplished in lucid dreams (failures most often occur due to awakening or hindrances within the dream environment). This seems to be borne out by our own study: Recall that half of the data sets had to be excluded because dreamers failed to carry out the task.

Next, the sleep recordings for the present study were conducted over the period of several years and the electrode montage has slightly changed over the time. The first two conditions (counting and walking) were recorded in accordance with the guidelines by Rechtschaffen and Kales (1968), while the third condition (gymnastic) was recorded in accordance with the American Academy of Sleep Medicine (2008) guidelines.

It should also be mentioned that in the present study lucid dreams were used to explore a special feature of a motor routine and that the results and conclusion should not be generalized to “the dream state” as a matter of course. Dreams in general—referring to REM dreams—also include non-lucid dreams. An EEG study by Voss et al. (2009) indicated that there might be a difference between lucid and non-lucid REM sleep concerning frontal lobe activation. These findings are supported by Dresler et al. (2012) who demonstrated in an EEG/fMRI study that during the lucid dream state a network of different brain areas appear to be reactivated which are normally deactivated during REM sleep (including prefrontal, occipito-temporal cortices, precuneus, cuneus, parietal lobules). These studies do not indicate differences between lucid and non-lucid dreams concerning motor activity per se. However, we cannot simply exclude such a difference a priori. Future studies using EEG/fMRI recordings should also investigate motor activation during non-lucid dreams, based upon the correlation of activation patterns and reported motor activity.

It is also worth mentioning that in our study the counting and walking task was performed at the participants' own regular pace, e.g., counting to 10 did not match 10 s of physical clock time (see also Table 2). LaBerge (1985) for example explicitly trained his participants to estimate a specific interval of time as accurately as possible, namely 10 s by counting “One thousand and one, one thousand and two, … one thousand and ten” at a rate attempting to match 10 s of physical clock time. In our study for the counting and walking condition, we did not intend to match the lucid time durations exactly to physical clock time (e.g., 10 s). This allows participants to do the task at their own pace and has the advantage that they don't have to pay attention to this additional demand of concentrating to match a certain time interval. However, for the gymnastic routine the participants were trained to match the walking 10 steps condition regarding the task duration in wakefulness.

Effects of Task Modality

Two different task modalities were used in the present study: those involving motor activity (walking and gymnastic conditions) and those not involving motor activity (counting condition). While increased durations in lucid dreams were observed for both modalities, only tasks with motor activity resulted in significant increases in time (with the caution of possible type II error for counting). These findings are in accordance with Erlacher and Schredl (2004) who also demonstrated that a task involving motor activity (performing squats) yielded an increased duration in lucid dreams. In contrast, tasks which did not involve motor activity (counting) led to negligible differences between wakefulness and lucid dreaming (3.5 and 9.6%). Also no differences were found in study by LaBerge (1985). However, in the present study the difference for counting was considerably higher (27.2%) and it is possible that only the small sample size did not allow it to reach statistical significance. Thus, while prolonged times are quite consistent across the range of different tasks involving motor activity (walking, gymnastics, performing squats), the findings regarding tasks without motor activity (counting) are still inconclusive.

It is important to note that all our conditions actually involved counting. Thus it is possible that the counting itself had an influence on the duration of the motor tasks. Therefore motor tasks which do not involve counting should be investigated in future studies in order to find out if the prolonged durations can still be found and if the extent of a probable increase is smaller or higher than when counting is involved.

Taking a closer look, there was also motor activity in the counting condition because participants were asked to count aloud. Even though the motor activation of the muscles involved during counting seems negligible in contrast to the gross motor activation during walking or the gymnastic routine, future studies should explore the difference for counting aloud and silent.

Effects of Task Length

In two conditions (counting and walking), in addition to the absolute task time, also interim task times (after counting to 10 and to 20; and after walking 10 and 20 steps) have been measured. The analysis showed that relative times for both conditions did not differ between wakefulness and the lucid dream state. This was also true for one participant who accidentally ran the 10, 20, and 30 steps in his dream. Therefore it appears that extended durations in lucid dreams are not dependent on the task length or, in other words, there is not a disproportional time effect when accomplishing longer tasks.

It is worth mentioning that we did not randomize the order of lengths (e.g., P1: 10, 20, 30; P2: 30, 20, 10; etc.). This might confound the results with respect to order effects, however, one might speculate that possible order effects should have distorted the relative times in a systematic proportional way, but this was not the case.

Effects of Task Complexity

Two different tasks with motor activity were included in the present study: a simple motor task (walking) and a complex motor task (gymnastic routine). While both motor tasks resulted in increased durations in lucid dreams, greater complexity of the task was not associated with greater increases in time. In fact, the trend was even in the opposite direction: Highest increases were observed for the most simple task, walking (52.5%), followed by somewhat more complex task from a previous study, performing squats (39.9%; Erlacher and Schredl, 2004), and finishing with the lowest increases for the most complex task, gymnastic routine (23.3%). While it is not clear if these differences just occurred by chance or there is indeed some inverse relationship between the task complexity and prolonged durations in lucid dreams, from the present data we conclude that more complex actions do not lead to longer durations.

However, it is important to acknowledge, that it is nearly impossible to provide an exact definition of “complexity” (Wulf and Shea, 2002) and the concept has been used in various ways. For example, Guillot and Collet (2005) use this notion in the sense of highly automatic movements (simple) in comparison to cyclical closed movements (complex). The gymnastic routine task, which has been employed in the present study, can be termed complex in several ways: it consisted of a sequence of different elements and was therefore a discrete as opposed to a continuous (walking) motor task. Also the various elements required higher levels of motor coordination and balance. It is still to be investigated whether and to what extent motor tasks which are complex in other ways than the gymnastic routine (e.g., regarding attention, task difficulty) affect dream state durations.

Explaining Extended Durations

Since the difference in duration between wakefulness and the dream state was observed only for the tasks which involved motor activity, it is worth taking a look into studies which investigated the durations of motor tasks which were mentally simulated by participants while awake. Both in mental simulations and in the dream state motor activity is performed only in one's mind, without moving the physical body. Some mental simulation studies indeed found prolonged durations for mental simulations of walking tasks (Decety et al., 1989; Decety and Jeannerod, 1995) as well as in golf, swimming and weight lifting (for overview see Guillot and Collet, 2005). The difficulty of task, perceived force and skill complexity seem to be time-enhancing factors (Guillot and Collet, 2005). However, the findings from mental simulation studies are ambiguous: Some authors report equivalence of time (e.g., Munzert, 2002), others found shortened durations (Calmels and Fournier, 2001).

One possible explanation from mental stimulation studies for the prolonged durations might be centrally encoded force (Jeannerod, 1994). In the experiment by Decety et al. (1989) the participants who mentally simulated a walking task with an actual 25-kg weight on their back had increased mental simulation durations by about 30%. Jeannerod (1994) suggests that somehow the programmed increased level of force—as a reaction to the actual weight perceived—could not be used to overcome physical resistance and was thus misread by participants as a longer duration. Physically perceived force thus led to the program “increased effort required.” In dreams the perceived force, in the sense of gravity or resistance, might not correspond to the ordinary gravity force in wakefulness, because no real gravity force exists in the dream simulation and muscular feedback is lacking due to REM sleep atonia. Therefore the movements may also be programmed with “increased effort” to compensate for the lack of muscular feedback.

Another possible explanation might be related to neural specifics of REM sleep. Louie and Wilson (2001) found that when rats were trained in a behavioral task their hippocampal activity during the task in wakefulness was replayed in REM sleep but with a somewhat different temporal scaling factor. Most scaling factors were bigger than 1.0 (i.e., there was a slower corresponding activity during REM sleep) and the average was 1.4 ± 0.6. This average duration increase by 40% in REM sleep are in line with our findings on increased duration of motor tasks in lucid dreams (gymnastic: 23.3%; squats: 39.9%; walking: 52.5%). However, it is not clear if the observed replayed neural patterns are indeed linked to (dreamed) motor activity or if they rather represent learning procedures regarding temporal-spatial orientation. The task for the rats involved motor activity and therefore it is possible that the observed neural activity during REM sleep was connected to motor learning, although it is impossible to say if the rats actually dreamed of accomplishing the task. Louie and Wilson (2001) also found that the theta EEG rhythm during REM sleep was about 1.2 times slower compared to the practice in wakefulness and therefore provides two possible explanations. Firstly, this might reflect a globally slower neural processing during sleep due to lower brain temperature. Further, the theta rhythm itself might serve as a pacing mechanism to coordinate interactions during information processing across multiple brain regions.

Finally, it is important to underline that in each condition two participants also produced quite similar time or even slightly shorter times compared to wakefulness. Unfortunately, from our data it is not possible to conclude why those participants performed differently. For example, P1m28 was a highly frequent lucid dreamer and he showed very exact times in his lucid dreams. On the other side, P6f24, who also showed quite exact yet slightly shorter time in the walking condition during her lucid dream, was a very infrequent lucid dreamer.

Implications for Sports Science

The relative timing of motor skills plays an important role in motor control theories. Schmidt (1975), for example, proposed in the motor schema theory that the relative time (e.g., the temporal structure of a motor skill) is an invariant component of a so-called generalized motor program and that parameters could scale this structure proportionately in time. For example, throwing a ball can be done fast or slow, however, the relative timing of the involved force impulse need to be proportional in order to speak of the same motor skill. If the relative time structure is not rigidly structured within a certain motor skill then this action is just something else but not the motor skill at hand (e.g., throwing a ball is no longer throwing but something else). The present findings of this study demonstrate that despite the longer absolute durations for tasks involving motor activity, the relative durations remain the same. This finding has important implications for lucid dream applications, such as using lucid dreams for motor skill practice: Athletes practicing long movement sequences seem to practice the same movement sequences as in wakefulness because the temporal structure is still given in their lucid dreams. With respect to relative time issues, it seems that lucid dreaming can be successfully applied for motor skill learning in sports (cf. Erlacher, 2007).

Practice in lucid dreams is similar to mental rehearsal in wakefulness: Movements are rehearsed with an imagined body on a cognitive level. Mental rehearsal is a well-established and widely used technique in sports science and practice. Meta-analyses (Feltz and Landers, 1983; Driskell et al., 1994) demonstrated that it has a positive and significant effect on performance. The evidence suggests that imagined and executed actions to some extent seem to share the same central neural structures. Decety (1996) presented three lines of evidence in support of this correspondence hypothesis: measurement of central nervous activity, autonomic responses, and mental chronometry. Similar correspondence can be demonstrated between dreamed actions in REM sleep and executed actions in wakefulness (Fenwick et al., 1984; LaBerge, 1990; Erlacher and Schredl, 2008b). The present study provides further evidence about the correspondence of mental chronometry (albeit with some scaling factor).

Previous studies with lucid dreamers demonstrated that complex sports skills, such as skiing or gymnastics, can indeed be successfully practiced in lucid dreams (Tholey, 1981). Also in this study, the participants were able to memorize a gymnastic routine and to recall and perform it within a lucid dream. It seems that athletes indeed are able to perform their sports in lucid dreams (Erlacher et al., 2011–2012) and that practice in lucid dreams can increase performance in wakefulness (Erlacher and Schredl, 2010).

Future Directions

The present findings should be replicated in future studies by using bigger sample sizes. It might be possible that not only experienced lucid dreamers can be involved, but also novices, supported by a lucid dream induction technique. In the third condition of the present study, some participants were not experienced lucid dreamers but sport students who took part in a lucid dream induction study. Nevertheless some of them were able to have their first lucid dream and successfully accomplished the requested task in it. A plethora of different methods have been suggested for lucid dream induction and some of them do look promising (see Stumbrys et al., 2012).

Future studies should explore the discrepancies found in the counting condition, as well a possible negative relation between the task complexity and prolonged times, i.e., that more simple motor tasks for some reason lead to longer durations. Further, measures of perceived effort (e.g., Borg, 1982) could be included to explore the relationship between prolonged durations and perceived effort when accomplishing a motor task. Also it might be worth investigating other possible influencing factors that were found to have an effect on durations in mental simulations, e.g., the level of expertise and task familiarity (Guillot and Collet, 2005). Concerning the features of the tasks used in our own studies, it might also be worth exploring possible differences between continuous (walking, squats) and discrete (gymnastic routine) motor tasks.

One of the difficulties with chronometric lucid dream research is that it mainly relies on subjective time perception. Therefore it would be interesting to approach this problem with another way of measuring the durations of dreamed actions by incorporating physical time intervals into lucid dreams with external auditory signals. In a recent study Strelen (2006) showed that in a lucid dream the dreamer can hear and distinguish an externally provided acoustic stimulus. These audio cues could serve as a start and stop signal of an interval, during which lucid dreamers, for example, could count numbers or count their steps while walking. The problem of subjectivity within dreams of course could not be avoided, however, this would allow another comparison of physical clock time with subjective time experience in lucid dreams.


Conclusion


In summary, the present study confirms the findings of Erlacher and Schredl (2004) that motor actions lead to prolonged durations in lucid dreams. The findings for the durations of cognitive actions (without motor activity) are as yet inconclusive. The relative time structure of motor tasks that last longer in the dream state than in wakefulness do not result in disproportional task durations in the dream state. Lucid dreams, therefore, can be successfully applied for motor skill practice in sports, music and other areas. Prolonged durations might be related to the lack of muscular feedback or slower neural processing during REM sleep. Future studies should explore factors that might be associated with prolonged durations (e.g., level of perceived effort, continuous vs. discrete tasks, motor task with counting vs. without counting) and try to incorporate physical time intervals within the dream by external auditory signals (e.g., implementing audio cues as start and stop signals).

Conflict of Interest Statement

The authors declare that the research was conducted in the absence of any commercial or financial relationships that could be construed as a potential conflict of interest.

Acknowledgments

This project was funded by the BIAL Foundation, Portugal (Grant 72/06).

Supplementary Material

The Supplementary Material for this article can be found online at: http://www.frontiersin.org/journal/10.3389/fpsyg.2013.01013/abstract


References are available at the Frontiers site.

Living the Good Life: Positive Psychology and Flourishing


Corey Keyes is the co-author, with Jonathan Haidt, Flourishing: Positive Psychology and the Life Well-Lived (2002, Kindle edition), co-editor of Well-Being: Positive Development Across the Life Course (2013), and editor of Mental Well-Being: International Contributions to the Study of Positive Mental Health (2012), among other books. He gave this talk at Emory University.

Living the Good Life: Positive Psychology and Flourishing

Published on Feb 27, 2014


In this first talk of "The Good Life" speaker series, Corey Keyes, Professor of Sociology, addresses "Positive Psychology and Flourishing" (Feb. 25, 2014).

Prof. Keyes was a member of a MacArthur Foundation Research Network on Successful Midlife Development, a co-chair of the first Positive Psychology Summit in 1999, and a member of the 2007 National Academies of Science Keck Futures Initiative on The Future of Human Healthspan: Demography, Evolution, Medicine, and Bioengineering. He is a senior fellow at Emory University's Center for the Study of Law and Religion and its multidisciplinary five-year project—Pursuit of Happiness—funded in part by the Templeton Foundation. His research centers on illuminating the two-continua model of mental health and illness—showing how the absence of mental illness does not translate into the presence of "flourishing" mental health and revealing that the biological and psychosocial causes of true health are often distinct processes from those now understood as the causes of illness. This work is being applied to better understanding resilience and prevention of mental illness and informs the growing approach called predictive health care, which seeks to apply novel responses to correct early deviations from true health to maintain health and limit disease and illness.

The Good Life Speaker Series seeks to facilitate a meaningful exchange of ideas on how to lead the "good life," based on Socrates' concept of Eudaemonia. We aim to attract speakers whose experiences and knowledge provide distinctive and challenging understandings on how to lead such a life. Our goal in doing so is that an audience, comprised primarily of students, can benefit from their wisdom as they move forward constructing their own personal version of the good life.

Thursday, March 06, 2014

Fruits and Vegetables: This Is What Your Grandma Never Taught You (Precision Nutrition)

This is a very cool graphic on the amounts and colors of fruits and vegetables we should be getting in our daily diet. This comes via John Berardi and Ryan Andrews at Precision Nutrition.

You're welcome.

Fruits and Vegetables

This is what your grandma never taught you [Infographic]

By John Berardi and Ryan Andrews

Fruits and vegetables’ vibrant colors tell the story of their “super powers”. You see, it’s their “phytonutrients”, or plant nutrients, that help us fight disease and stay stronger for longer.

Learn what the phytonutrients do — and how much of each you need to be healthy — in the infographic below.

Then download this free Phytonutrient Cheat Sheet. Print it out. Stick it on your fridge. It’ll help you track how many servings of each color you’re getting every day.


Eat, move, and live… better. The health and fitness world can sometimes be a confusing place. But it doesn’t have to be. Let us help you make sense of it all with this free special report. In it you’ll learn the best eating, exercise, and lifestyle strategies – unique and personal – for you.

Click here to download the special report, for free.

Higher Blood Levels of Omega-3 Fats Associated with Preservation of Executive Function in Aging Adults

In this paper that appeared in Frontiers in Aging Neuroscience toward the end of 2013, researchers found that there is a significant correlation between plasma omega-3 fatty acids and the maintenance of executive function in aging adults (mean age = 86).
Each 100 μg/ml increase in plasma O3PUFA associated with 4 s less change in executive decline per year of aging (p = 0.02, fully adjusted model). O3PUFA was not associated with verbal memory or global cognitive changes.
The 4 s means 4 seconds faster on a cognitive test.
These estimates indicate that an individual with an O3PUFA concentration of 200 μg/ml might be expected to complete the Trails B task 4 s faster than an individual with an O3PUFA of 100 μg/ml per year of aging. Given that each year of aging in our population was associated with a mean increase in Trails B completion time of approximately 4 s over the duration of follow up, these estimates indicate a 1 year delay in age-dependent executive decline per 100 μg/ml baseline O3PUFA concentration.
Eat your fish and take your fish oil supplements and you, too, can have a functional brain in old age.


Full Citation:
Bowman GL, Dodge HH, Mattek N, Barbey AK, Silbert LC, Shinto L, Howieson DB, Kaye JA and Quinn JF. (2013, Dec 16). Plasma omega-3 PUFA and white matter mediated executive decline in older adults. Frontiers in Aging Neuroscience; 5:92. doi: 10.3389/fnagi.2013.00092

Plasma omega-3 PUFA and white matter mediated executive decline in older adults

Gene L. Bowman [1], Hiroko H. Dodge [1], Nora Mattek [1], Aron K. Barbey [2], Lisa C. Silbert [1], Lynne Shinto [1], Diane B. Howieson [1], Jeffrey A. Kaye [1] and Joseph F. Quinn [1]
1. Brain Institute, Department of Neurology, Oregon Health and Science University, Portland, OR, USA
2. Beckman Institute for Advanced Science and Technology, Urbana, IL, USA
Introduction: Cross-sectional studies have identified long chain omega-3 polyunsaturated fatty acids (eicosapentaenoic acid 20:5n-3 and docosahexaenoic acid 22:6n-3 (O3PUFA) in association with fewer white matter lesions and better executive function in older adults. We hypothesized that O3PUFA are associated with less executive decline over time and that total white matter hyperintensity volume (WMH) mediates this association.

Methods: Eighty-six non-demented older adults were followed over 4 years after measurement of plasma O3PUFA with annual evaluations of cognitive function. A subset of these participants also had brain MRI of total WMH available to conduct a formal mediation analysis of a putative relationship between O3PUFA and cognitive function.

Results: Mean age at baseline was 86, 62% were female and 11% carried the APOE4 allele. Each 100 μg/ml increase in plasma O3PUFA associated with 4 s less change in executive decline per year of aging (p = 0.02, fully adjusted model). O3PUFA was not associated with verbal memory or global cognitive changes. The significance of the association between O3PUFA and better executive function was lost once WMH was added to the regression model.

Conclusion: Executive decline with age appears to be a cognitive domain particularly sensitive to plasma O3PUFA in longitudinal examination. O3PUFA may modulate executive functioning by mechanisms underlying the development of WMH, a biologically plausible hypothesis that warrants further investigation.

Introduction


Delaying the onset of Alzheimer's disease and other late life dementias is an agenda budding across the globe. Characterizing the heterogeneity in structural and functional brain changes that relate to dementia risk will enable preventive therapies to target these characteristics in populations primed to gain benefit. Diet and nutrition pose a significant opportunity for prevention; however, success here also requires knowledge of the risk profile in order to engage appropriately.

Cerebral white matter hyperintensities (WMH), largely considered a marker of small vessel disease and dementia risk, are of significant interest to prevention strategies (Schmidt et al., 2003; Garde et al., 2005; Bastos Leite et al., 2006; Kramer et al., 2007; Silbert et al., 2008; Debette et al., 2010; Gorelick et al., 2011). These WMH are prevalent in 60–92% of non-demented elders age 65 and older and increase risk for cognitive impairment (de Leeuw et al., 2001; Silbert et al., 2009). WMH represents an early structural MRI risk factor for Mild Cognitive Impairment and dementia (Silbert et al., 2012), and thus, provides an attractive therapeutic target. The design of rational therapy for this early brain structural change requires knowledge of its pathophysiology. Both intake (Virtanen et al., 2008) and peripheral concentration of long chain omega-3 polyunsaturated fatty acids (O3PUFA) are associated with less WMH in cross–sectional studies (Bowman et al., 2012; Tan et al., 2012; Virtanen et al., 2013). Although the cognitive consequences associated with WMH accumulation may ultimately pervade several domains, executive dysfunction with impaired information processing and cognitive flexibility have been noted as early indicators of its accrual (Schmidt et al., 1993; DeCarli et al., 1995; Adak et al., 2004; Brickman et al., 2006; Verdelho et al., 2007). Intrigued by this fabric of literature, we tested the hypothesis that O3PUFA associates with less executive decline, and that WMH mediates the relationship between these fatty acids and executive function.

Materials and Methods


Study Population

The Oregon Brain Aging Study (OBAS) is a cohort study of brain aging in people age 65 and older free of usual confounding factors known at the time to modify the risk for cognitive decline (i.e., vascular disease, smoking, stroke, diabetes) (Kaye et al., 1994). Enrollment was opened in 2004 to also include volunteers with stable chronic conditions common with advanced age (i.e., hypertension, diabetes) to better represent the general population. Clinical, neuropsychometric and brain MRI are collected annually. Clinical Dementia Rating (CDR) (Morris, 1993) scale is based on interviews with the participant and their collateral historian about functioning and cognitive skills in conjunction with the MMSE (Folstein et al., 1975) and the Cognistat (Kiernan et al., 1987). Blood was collected appropriately for nutrient biomarkers beginning in the 2006–2007. Inclusion was restricted to non-demented participants (CDR ≤ 0.5). Eighty-six participants had plasma fatty acids and psychometric measures available for longitudinal analysis. Thirty-two of these 86 also had MRI collected at the time of the nutrient blood draw to permit a formal mediation analysis.

Standard Protocol Approval and Patient Consent

Informed consent was obtained from all subjects for participation in this study, which was approved by the institutional review board for human study at Oregon Health & Science University.

Biomarker Acquisition and Analysis


Plasma long-chain omega-3 fatty acids

Fasting blood was collected between the hours of 0700 and 1200 noon Pacific Standard Time beginning in September of 2006 and ending December 2007. Total lipid long chain n-3 polyunsaturated fatty acids as methyl esters were quantified using gas chromatography equipped with flame ionization detector and expressed as absolute plasma concentrations (μ g/mL)(Bowman et al., 2012). Plasma eicosapentaenoic acid (20:5n-3) and docosahexaenoic acid (22:6n-3) were combined (O3PUFA).

Volumetric brain MRI

Brain regions of interest were obtained using MRI 1.5 T magnet and REGION image analysis software. The procedures have been previously described (Mueller et al., 1998). Briefly, the sums of pixel areas for all slices were converted to volumetric measures by multiplying by the slice thickness for each of the following regions of interest: total white matter hyperintensity volume (WMH includes periventricular and subcortical deep signals) and supratentorial brain volume as total cerebral brain volume (TBV, excluding cerebellum and brain stem). Regression for brain tissue, CSF, and WMH collectively against bone creates a boundary along the inner table of the skull to determine the total intracranial volume. Additional boundaries were manually traced along the tentorium cerebelli and the superior border of the superior colliculus, the pons, and the fourth ventricle. The pituitary, vessels in the sphenoid region, and any sinuses that may have been included by the automatic regression were excluded manually. Using REGION's sampling tools, the analyst selects representative, unambiguous pixels of WMH (as well as brain tissue, fluid, and bone) from the multi-echo sequence display. Proton and T2 intensities are included in a regression model taking into account the location of each pixel that differentiates the tissue types. Distinction of WMH from brain tissue and fluid is achieved by visualizing higher signal intensities on proton density and T2 images. Inter-rater reliability coefficients using this approach for white matter segmentation are 0.85 and >0.95 for total intracranial, brain, and ventricular regions of interest.

Primary Outcomes and Potential Confounders


Neuropsychometrics

Previous cross-sectional analysis (Bowman et al., 2012) demonstrated O3PUFA in association with Trail Making Test Part B (Reitan, 1958), a measure commonly utilized to reflect executive function. This test was therefore used as our primary outcome measure for the current longitudinal analysis. WMS-R Logical Memory Story delayed (Wechsler, 1981) and the MMSE were also analyzed to resolve cognitive measures with apparent sensitivity to O3PUFA over time.

Potential confounders and other covariates

We utilized a parsimonious approach to our model building by including potential confounders on the basis of their previous association with cognitive decline. These included age (continuous), gender (man/women), education (continuous, years), APOE genotype determined using PCR (e4 carrier, y/n), hypertension (y/n), and depression (y/n). We restricted our covariates entered into the mediation analysis on the basis of their significant association with our outcomes of interest to avoid depleting degrees of freedom in a limited sample size (Supplementary Material, age and APOE4 carrier status, total intracranial volume). Covariates were collected and confirmed during the clinical interview (i.e., hypertension, depression).

Statistical Analysis

All statistics were performed in STATA v10.1 software (College Station, TX). Baseline differences in characteristics between those with and without MRI were calculated using independent t-test or Wilcoxon rank sum test for continuous variables and Pearson's chi-square test or Fisher's exact test for categorical variables as appropriate.

Longitudinal analysis

Linear mixed effects models estimated the mean and within-person slope of cognitive change by baseline plasma O3PUFA concentration. The mixed effects model accounts for the within-person correlations on repeated measures. The interaction term (O3PUFA x Age) represents the “effects” of the baseline O3PUFA on cognitive change over time (using age at visit as the time variable). We interpret this as the annual cognitive change per unit increase in baseline O3PUFA. In addition to considering O3PUFA as a continuous measure, we also examined the difference between O3PUFA 1-SD above the mean (>100 μg/ml) versus a lesser value in relation to cognitive change. O3PUFA dichotomized (>100 μg/ml or less) in this setting represents the between-group annual difference in slope of cognitive change (high vs. low).

Formal mediation analysis

This procedure was utilized in an attempt to better describe the role of O3PUFA in relation to WMH and cognitive function. Differences between participants with and without MRI are presented in Table 1. Our mediation analysis used the baseline data and a 3-step framework (Baron and Kenny, 1986). The first step attempts to reproduce the initial model that demonstrates the association between O3PUFA and cognitive function. In the second step, we examine the association between the proposed “mediator” (i.e., WMH) and cognitive function and O3PUFA with the mediator WMH. The third step includes O3PUFA and WMH as simultaneous predictors of cognitive function. Attenuation of the beta-coefficient >10% or loss of statistical significance (alpha level >0.05) was stated a priori to imply a mediation effect in this construct. These regression models were adjusted for variables that demonstrated a significant association with cognitive function in the study sample (alpha value <0.05, two-sided) (Supplementary Material).
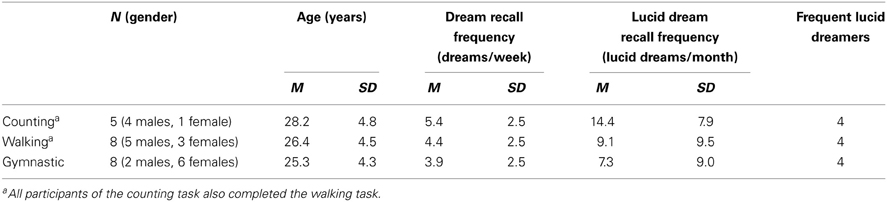
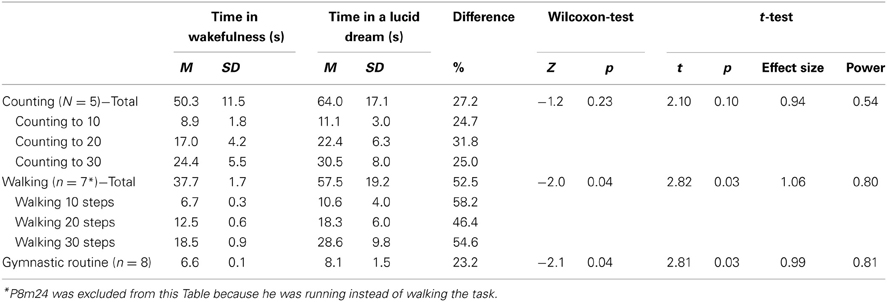
TABLE 1
http://www.frontiersin.org/files/Articles/69369/fnagi-05-00092-HTML/image_m/fnagi-05-00092-t001.jpg

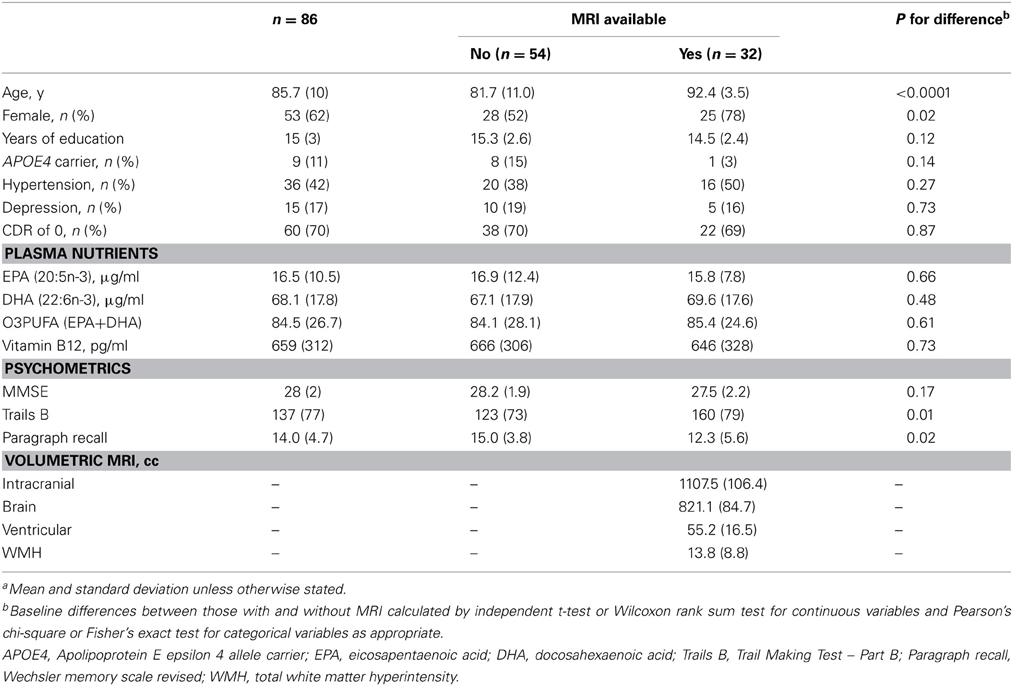
Table 1. Baseline characteristics of the study population(a).

Results


Sixty-two percent of the participants were female and the mean age at baseline was 86. Prevalence of APOE4 allele carrier status was 11% (Table 1). The mean MMSE was 28. Forty-two percent were being treated for hypertension and 17% for depression. Vitamin B12 deficiency was prevalent in 4%. Mean duration of follow-up was 3.9 years (range 1–5) (Table 1). Annual change in Trail Making Test Part B (Trails B) as measured by speed in test performance was 3.5 (± 0.42) s, −0.2 (± 0.04) points on WMS-R Delayed Paragraph Recall, and −0.1 (±0.02) points on MMSE.

In the results that follow, all subjects are included in the evaluation of relationships between O3PUFA and cognitive change (n = 86), while only those with MRI are included in the mediation analysis (n = 32). The participants with MRI were older and predominantly female in comparison to those without MRI (Table 1).

Plasma O3PUFA and Cognitive Decline (Table 2)

Plasma O3PUFA (EPA+DHA) was associated with less executive decline (Trails B) after adjustment for age, gender, education, APOE4, hypertension, and depression (p = 0.02) (Table 2). The magnitude of the association can be interpreted as a 4 s less decline on Trails B per year for each 100 μg/ml increase in plasma O3PUFA. These estimates indicate that an individual with an O3PUFA concentration of 200 μg/ml might be expected to complete the Trails B task 4 s faster than an individual with an O3PUFA of 100 μg/ml per year of aging. Given that each year of aging in our population was associated with a mean increase in Trails B completion time of approximately 4 s over the duration of follow up, these estimates indicate a 1 year delay in age-dependent executive decline per 100 μg/ml baseline O3PUFA concentration. By contrast, decline in Paragraph Recall (p = 0.83) and MMSE (p = 0.21) had no apparent relationship with O3PUFA.
TABLE 2
http://www.frontiersin.org/files/Articles/69369/fnagi-05-00092-HTML/image_m/fnagi-05-00092-t002.jpg

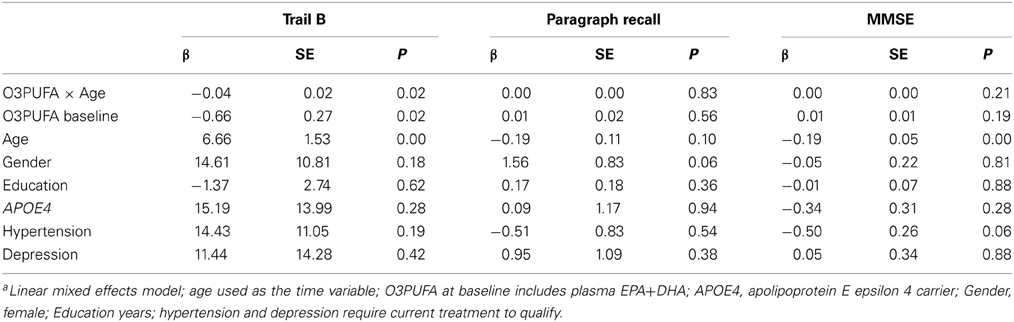
Table 2. Plasma O3PUFA and cognitive decline in older adults over 4-years (n = 86)a.
Figure 1 illustrates the deceleration in trajectory of executive decline in people with “high” plasma O3PUFA versus people below this threshold.
FIGURE 1
http://www.frontiersin.org/files/Articles/69369/fnagi-05-00092-HTML/image_m/fnagi-05-00092-g001.jpg

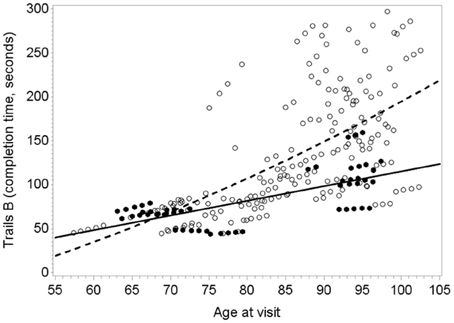
Figure 1. Predicted within-person(circles) and mean trajectory (lines) of executive decline for subjects with plasma O3PUFA concentration above 110 μ g/ml (dark circles, solidline) or below this threshold(open circles, dashed line) at base line (n = 86). Coefficient estimates calculated in the linear mixed effects model were used to predict trajectories. Participants with O3PUFA ≤110 μg/ml (open circles and line) had an accelerated rate of executive decline by 2.7 s per year (β = 2.7; 95% confidence interval −5.11 to −0.22; age, gender, education, APOE4, hyper tension, depression adjusted).
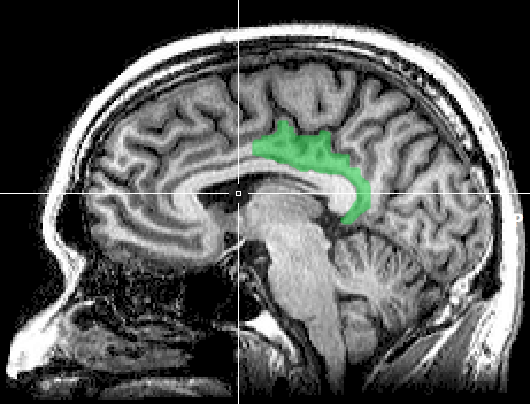
Plasma O3PUFA and WMH Mediated Executive Function (Figure 2)

O3PUFA associated with less WMH (β = −0.188, p = 0.007, Figure 2A) where O3PUFA explained 28.5% of the variance in total WMH (Figure 3). WMH burden associated with worse executive function (Trials B, β = 4557.87, p = 0.005, Figure 2B). O3PUFA associated with better executive function (Tails B, β = −1.15, p = 0.025, Figure 2C), however, after adding WMH as a “mediating” variable into the regression equation that included O3PUFA, age, APOE4 and total intracranial volume simultaneously as predictors of executive function, the significant association between O3PUFA and better executive function was lost (β = 0.54, p = 0.332, Figure 2D) and the WMH association with executive dysfunction remained marginally significant (β = 3589.95, p = 0.056, not illustrated in the Figure).
FIGURE 2
http://www.frontiersin.org/files/Articles/69369/fnagi-05-00092-HTML/image_m/fnagi-05-00092-g002.jpg

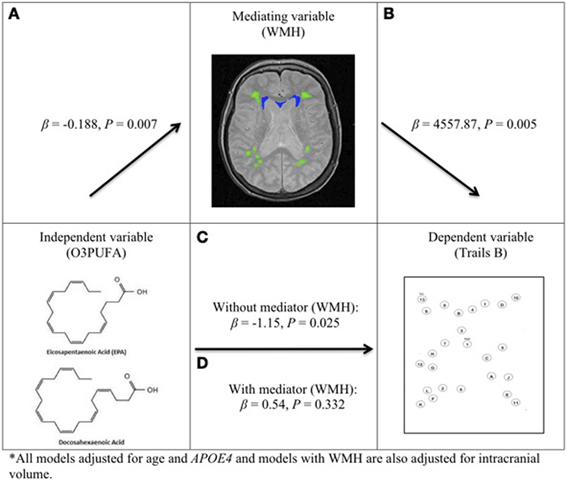
Figure 2. O3PUFA and white matter mediated executive function in older adults (n = 32). All models adjusted for age and APOE4, and models with WMH also adjusted for total intracranial volume. (A) Higher O3PUFA and less white matter hyper-intensities (WMH) highlighted in green (subcortical deep) and blue (periventricular). (B) Higher WMH and worse executive function (prolonged completion time for Trail B test). (C) Higher O3PUFA and better executive function (shorter completion time for Trail B test). (D) Association between O3PUFA and better executive function is lost once WMH is added to the regression model (P = 0.332) representing mediation.
FIGURE 3
  http://www.frontiersin.org/files/Articles/69369/fnagi-05-00092-HTML/image_m/fnagi-05-00092-g003.jpg

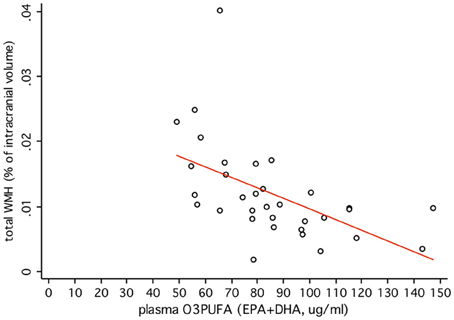
Figure 3. Plasma O3PUFA explains 28.5% of the total variance in WMH in non-demented older adults (n = 32).

Discussion


This longitudinal study of older adults at risk for dementia and followed over 4 years found significantly less executive decline in those with higher plasma O3PUFA at baseline. The calculated estimate indicates a 1-year delay in age-dependent executive decline per 100 μg/ml increase in plasma O3PUFA at baseline. We also found that plasma O3PUFA above 110 μg/ml associated with more stable executive function over time, which proposes one attainable threshold for neuroprotection. O3PUFA was not associated with verbal memory and MMSE. This implies that O3PUFA effects are more isolated to skills of executive function early on in people at risk for dementia. The mediation analysis further supports this notion since WMH accumulation is known to impact executive function and we demonstrate WMH mediation of the relationship between O3PUFA and executive dysfunction. Together, this evidence underlines important structural and functional brain parameters that seem well suited for targeting with O3PUFA therapy.

Delayed and logical verbal memory and MMSE changes were not associated with O3PUFA. However, executive decline appeared sensitive to O3PUFA. The mediation analysis is consistent with other literature indicating that prefrontal cortical executive skills are affected early during WMH accumulation (Schmidt et al., 1993; DeCarli et al., 1995; Adak et al., 2004; Brickman et al., 2006; Verdelho et al., 2007; Barbey et al., 2012). O3PUFA has pleiotropic effects that might explain this relationship, including effects on cerebral blood flow (Jackson et al., 2012), endothelial cell health (Yang et al., 2012), structural integrity of myelin (Pu et al., 2013), and preservation of neuronal energy with aging (Kuczynski et al., 2010).

Two other epidemiological studies have examined the relationship between O3PUFA and cognitive decline. Beydoun et al. (2007) were also unable to appreciate a relationship with global cognitive decline in the Atherosclerosis Risk in Communities Study. However, they did find O3PUFA associated with less decline in verbal/categorical fluency tasks which reflect executive control; requiring people to organize concepts in a novel way (i.e., naming words beginning with a particular letter or category with time constraints). They also report a more robust relationship in people with hypertension and dyslipidemia, two morbidities also sensitive to O3PUFA (Mozaffarian and Wu, 2011). Samieri et al. (2011) did not observe a relationship between O3PUFA (DHA or EPA) and MMSE change over 7 years in a Bordeaux subset of the 3 City study or an association with executive decline represented by Trails B. This inconsistency with our results in OBAS may be attributed to several factors, including differences in O3PUFA measures themselves (EPA and DHA as a relative percentage of total fatty acids versus an absolute concentration that appears more informative in our OBAS sample that has both), the age of the cohort (mean age 74 vs. 86 in OBAS), slower annual rates of executive decline (about 1 s/year decline in Trails B vs. 4 s/year in OBAS), and the potential for lower WMH prevalence in the Bordeaux sample compared with OBAS.

Several clinical trials to prevent age-related cognitive decline in the cognitively intact using O3PUFA therapy have been completed (van de Rest et al., 2008; Dangour et al., 2010; Geleijnse et al., 2012) and others are underway (Danthiir et al., 2011). Each completed trial has been unsuccessful, however, the current study results suggest that the design of the clinical trials themselves may explain the null effect. For example, one trial enrolled non-demented subjects age 66–74 and followed subjects for only 6 months and executive function was examined (van de Rest et al., 2008). Another trial included secondary outcomes of executive function (e.g., digit span backwards and animal naming), but Trails B itself was not administered, and the population was at low vascular risk, younger age, and follow-up duration was limited at 2 years (Dangour et al., 2010). Geleijnse et al trial did examine a population with vascular risk (Geleijnse et al., 2012), but employed the MMSE as the primary outcome, which now has consistently shown to be insensitive to O3PUFA in observational and experimental studies of older adults at risk for dementia.

There were limitations in our study. We have plasma O3PUFA measurements available from a single time point in each participant, and we assume that this is a reasonable representation of long-term O3PUFA status, the type of nutritional exposure most inherently significant to brain aging. Our sample size is smaller than studies of cognitive aging and incident dementia using subjective measures of dietary intake (i.e., food frequency questionnaire). However, studies using self-report are susceptible to measurement error that we circumvent by utilizing quantitative nutrient biomarkers (Bowman et al., 2011; Tangney and Scarmeas, 2012). These permits more power, and, in turn a more conservative sample size to identify important relationships.

In conclusion, these results add longitudinal data to a limited body of literature that further indicate WMH and executive function as features of cognitive aging that appear sensitive to O3PUFA early in the evolution of cognitive decline. The hypothesis that O3PUFA can prevent vascular cognitive aging warrants further study.

Conflict of Interest Statement

The authors declare that the research was conducted in the absence of any commercial or financial relationships that could be construed as a potential conflict of interest.

Acknowledgments

Study support provided by the NIH (K23-AT00004777, R01-AG043398-01A1, RR024140) and the Portland VA Medical Center, Dr. Bowman conceptualized the study, led the acquisition and analysis of the fatty acids, drafted the analysis plan, interpreted the data, and composed the manuscript. His brain nutrition research is supported by the NIH (K23AT004777, R01AG043398-01A1) and Abbott Nutrition grants. Dr. Dodge supervised the data analysis and made substantive contribution in interpretation of results for the manuscript. She holds NIH support (K01 AG023014, P30 AG008017, R01 AG033581) and Scientific Review Board of the National Alzheimer's Coordinating Center duties. Dr. Silbert contributed in the interpretation of the brain scans and offered substantive contribution in the revision of the manuscript for intellectual content. She holds research support from the NIH (1R01AG036772, P30 AG008017, P50 NS062684) and receives Medicare and commercial insurance plan coverage for clinical care and intra-operative neurophysiological monitoring, and care provider at the Portland VA Medical Center. Dr. Barbey contributed in the interpretation of the neural mechanisms underlying prefrontal executive functions. Dr. Shinto receives salary and research support from the NIH, patient insurance reimbursement and made a substantive contribution in revising the manuscript for intellectual content. Ms. Nora Mattek reports no disclosures and made a substantive contribution in data quality assurance and technical details in the figures. Dr. Howieson assisted in the interpretation of neuropsychological evaluations and made a substantive contribution in revising the manuscript for intellectual content. She receives salary support from the NIH and insurance reimbursement from Medicare and other sources for providing patient care. Dr. Kaye assisted in the interpretation of the data and made a substantive contribution in revising the manuscript for intellectual content. He receives research support from the Department of Veterans Affairs (Merit Review grant) and the NIH (P30 AG008017, R01 AG024059, P30 AG024978, U01 AG010483); directs a center that receives research support from the NIH, Elan Corporation, Intel Corporation; receives reimbursement through Medicare and commercial insurance plans for providing patient care; is salaried to see patients at the Portland VA Medical Center; serves as an unpaid Chair for the Work Group on Technology and for the National Alzheimer's Association and as an unpaid Commissioner for the Center for Aging Services and Technologies; receives an annual royalty from sales of the book, Evidence-based Dementia Practice; and serves on the editorial advisory board of the journal, Alzheimer's & Dementia. Dr. Quinn assisted in the interpretation of the data and made a substantive contribution in revising the manuscript for intellectual content. Dr. Quinn has received honoraria for speaking from Pfizer, Novartis, and Forrest and for consulting from Phylogeny, Inc. Dr. Quinn is a co-inventor on a patent for the use of DHA for the treatment of Alzheimer's disease. Dr. Quinn receives compensation for conducting clinical trials from Elan, Bristol Myers, and Baxter. Dr. Quinn receives funding from the NIH and Department of Veterans Affairs.

Supplementary Material

The Supplementary Material for this article can be found online at: http://www.frontiersin.org/journal/10.3389/fnagi.2013.00092/abstract

References are available at the Frontiers site.